Someone lands on your page, reads it, gets what they need, and leaves. Did your site fail? According to bounce rate, maybe. According to common sense, no.
Bounce rate is one of the most quoted and most misunderstood metrics in analytics. People treat it as a grade for their website, when it’s really just a description of one specific behavior. Used carelessly, it sends you chasing the wrong problems.
This guide explains what bounce rate actually measures, why a “high” number isn’t automatically bad, and how to read it in context. No fluff — just a clear way to think about the metric so you stop misjudging your pages.
What Is Bounce Rate?
Bounce rate is the percentage of sessions on your site that included only a single page view and no other tracked interaction. In plain terms, the visitor arrived on one page, did nothing the analytics tool counted as engagement, and left without going anywhere else.
The classic formula looks like this:
Bounce rate = Single-page sessions / Total sessions × 100So if 1,000 people visit a page and 600 of them leave without a second interaction, your bounce rate for that page is 60%. The number itself is simple. The interpretation is where most people go wrong.
A Bounce Isn’t Always a Failure
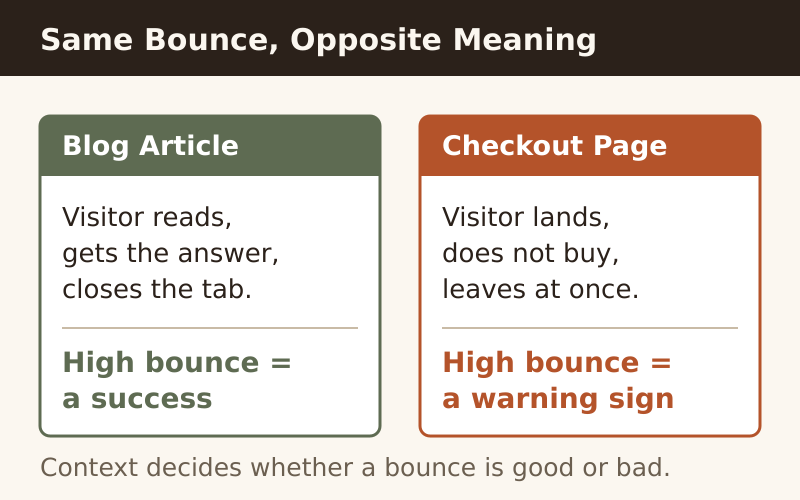
Here’s the key insight: a bounce only tells you that one session ended after one page. It says nothing about whether the visitor was satisfied. Consider a reader who searches “what is bounce rate,” lands on a thorough article, gets a complete answer, and closes the tab. That’s a bounce — and a success.
Now compare that to a checkout page with an 80% bounce rate. Same metric, completely different meaning. On a transactional page, that number is a warning sign. Context decides everything.
Bounce Rate vs. Engagement Rate
You may notice that some modern analytics tools no longer lead with bounce rate. Instead, they highlight engagement rate — essentially the inverse, expressed in a more positive frame. The two are closely related, so it helps to see them side by side.
| Metric | What it counts | What “good” looks like |
|---|---|---|
| Bounce rate | Sessions with no further interaction | Lower is usually better |
| Engagement rate | Sessions that lasted, scrolled, or converted | Higher is usually better |
The important difference is the definition of “engagement.” Older tools counted any second pageview as engagement. Newer tools often count a session as engaged if it lasts beyond a threshold (say, ten seconds), includes a conversion event, or records multiple pageviews. As a result, the exact same visitor behavior can produce different bounce numbers in different platforms. Always check how your specific tool defines the term before comparing figures.
What Affects Bounce Rate
Before you panic over a number, understand what drives it. Several factors push bounce rate up or down, and many have nothing to do with content quality.
- Page type: Blog posts and reference pages bounce more than product or category pages. That’s normal.
- Traffic source: Visitors from a specific search query behave differently from social or display traffic.
- Intent match: If your page answers the question fully, people leave satisfied — and bounce.
- Load speed: Slow pages drive impatient visitors away before they engage.
- Measurement setup: Whether you track scrolls, clicks, or timers changes the number dramatically.
That last point matters more than people realize. If you add an event that fires when a visitor scrolls halfway down the page, your bounce rate can drop overnight — not because behavior changed, but because your definition of “engaged” did. This is exactly the kind of trap that makes raw metrics misleading without proper context.
How to Read Bounce Rate Correctly
Instead of asking “is my bounce rate good or bad,” ask better questions. Here’s a practical sequence I use when reviewing a page.
- What’s the page’s job? An article that informs has done its job even if the visitor leaves. A landing page meant to capture a lead has not.
- Where did the traffic come from? Segment by source. A 70% bounce from broad social traffic and a 70% bounce from high-intent search are different stories.
- What’s the trend? A single snapshot means little. A bounce rate climbing month over month on a conversion page is the real alarm.
- What does engaged time say? Pair bounce rate with average time on page. Long time plus high bounce often means “satisfied reader,” not “failure.”
This is the same principle behind reading any single number: one metric in isolation lies. To understand performance, you have to connect signals. The same way funnel analysis shows where people drop off across steps, bounce rate only becomes useful once you know which page it describes and what that page is supposed to achieve.
When to Actually Worry
So when is a high bounce rate a genuine problem? Watch for these situations specifically.
- A page designed to drive a next action (sign-up, add-to-cart, contact) has a bounce rate well above your other conversion pages.
- Bounce rate spikes suddenly after a redesign, a speed regression, or a tracking change.
- Paid traffic you’re paying for lands and leaves immediately — you’re burning budget on a mismatch.
- A page targeting a commercial query bounces hard, suggesting the content doesn’t match what those searchers wanted.
In each case, the fix isn’t to “lower bounce rate.” That’s backwards. The fix is to improve the underlying mismatch — clearer messaging, faster load, better intent alignment — and let the metric follow. Chasing the number directly tends to produce gimmicks, like auto-playing content or forced interactions, that hurt the visitor experience.
Common Mistakes
A few recurring errors trip people up. Avoid these and you’ll already be ahead of most teams.
- Comparing across tools. Different platforms define a bounce differently. The numbers aren’t interchangeable.
- Setting a universal target. There’s no magic “good” bounce rate. A reference site and a store can’t share a benchmark.
- Ignoring the page’s purpose. Judging an FAQ page by store standards guarantees a wrong conclusion.
- Reading it without segmentation. A site-wide average hides far more than it reveals.
If you treat bounce rate as a starting question rather than a final verdict, you’ll use it the way it was meant to be used. It points you toward pages worth investigating. It doesn’t grade them for you.
Key Takeaways
Used well, bounce rate is a useful diagnostic. Used as a report card, it misleads. Keep these principles in mind:
- Bounce rate measures single-page sessions, not satisfaction. A bounce can be a happy ending.
- Context is everything — page purpose, traffic source, and intent decide whether a number is good.
- Definitions vary by tool, so never compare bounce figures across platforms at face value.
- Pair it with engaged time and segment by source before drawing any conclusion.
- Worry when conversion-focused pages bounce hard or when the number spikes after a change.
Ultimately, bounce rate is a flashlight, not a scoreboard. It shows you where to look. The judgment about whether a page is working still belongs to you — informed by what the page is for and who’s arriving on it.