You launch campaigns, look at dashboards, and still feel unsure about what actually works. One report says your ads are “performing well”. Another says your cost per lead is rising. Your gut feeling and your data keep arguing with each other.
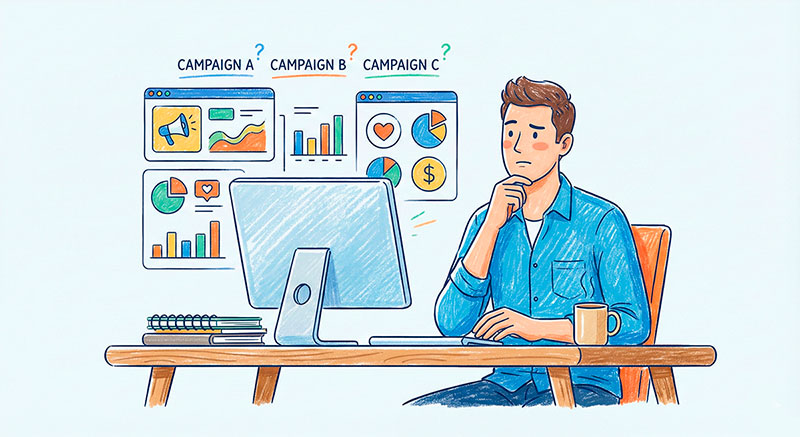
If this sounds familiar, you’re not alone. Many marketers and founders collect a lot of numbers, but very few turn those numbers into clear decisions.
If you’ve ever typed a basic question about analytics for digital marketing into a search box and closed the tab more confused than before, this guide is for you. We’ll walk through what’s really hiding behind the buzzwords, how different types of analytics fit together, and how they help you move from “more traffic” to “better results”.
By the end, you’ll see how events, funnels, and a few simple metrics can give you a much clearer picture of your marketing than a huge, complicated report ever could.
What Is Digital Marketing Analytics, in Plain English?
A Simple Definition of This Type of Analytics
Let’s start with a simple definition. Digital marketing analytics is the way you connect what you do in marketing with what happens to your business. You launch campaigns, people click on them, visit your site, sign up, buy, or leave. Analytics is the structured way to measure these steps and turn them into insights.
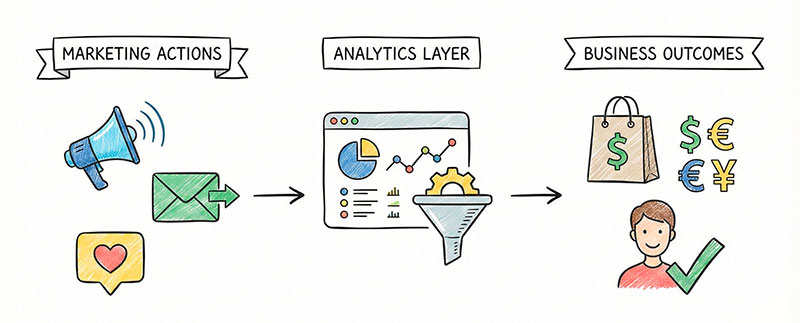
In other words, instead of asking “Did we get a lot of clicks?”, you start asking “Did this campaign bring us people who actually became customers?” The goal is not to stare at charts, but to answer practical questions about channels, messages, audiences, and budgets.
Mini Example: From an Ad Click to a Real Sale
Imagine you run a simple campaign for an online course.
- A person sees your ad in their feed.
- They click and land on your course page.
- They scroll, read the benefits, and hit the “Sign up” button.
- They fill out a form.
- They pay and get access to the course.
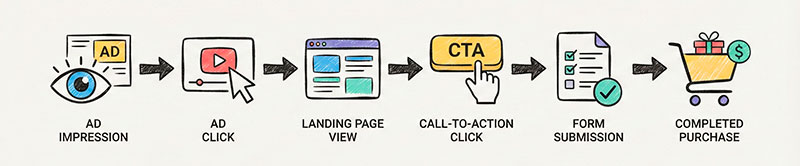
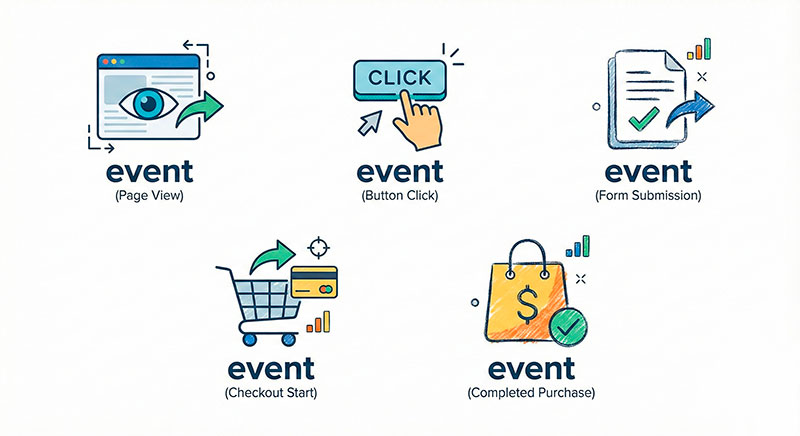
In a good analytics setup, each of these moments can be captured as an event:
ad_viewad_clicklanding_page_viewcta_clicksignup_form_submitpurchase_completed
Your tool also stores useful properties with these events, such as campaign name, device type, or country.
Now you can see a story, not just isolated numbers. You can answer questions like:
- Which campaign brings the most people who actually submit the form?
- Which audience segment clicks a lot but almost never buys?
- Does mobile traffic drop off more often than desktop on the payment step?
That’s the heart of analytics for marketing: turning a messy stream of visits and clicks into a clear path from first touch to revenue.
Digital Analytics vs Marketing Analytics vs Experience Analytics
What Is Digital Analytics?
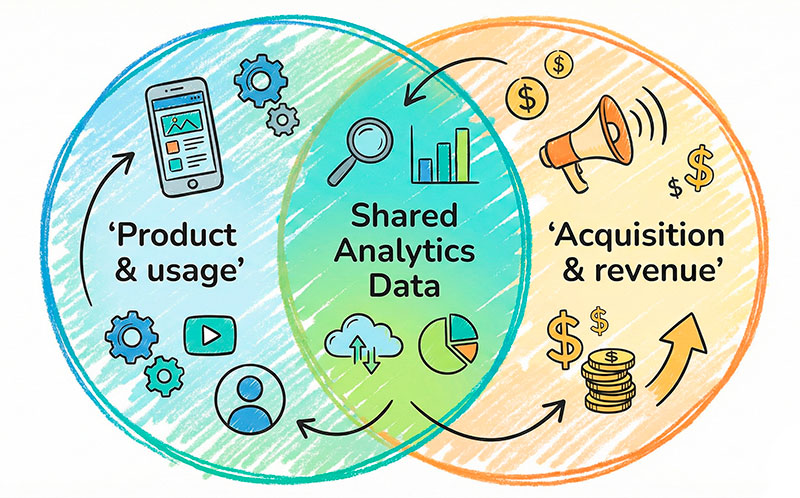
Before we stay with marketing, it helps to zoom out. Digital analytics is the umbrella that covers data from your websites, mobile apps, product features, and campaigns.
A simple digital analytics definition your team can remember is this: it is the practice of collecting and analyzing data about how people interact with your digital touchpoints, so you can improve both your product and your marketing.
When you think this way, you stop treating “marketing data” and “product data” as two different worlds. Instead, you see one journey that crosses ads, landing pages, onboarding, and long-term usage.
Where Marketing Analytics Fits In
Marketing analytics is a subset of this bigger picture. It focuses on everything that happens around your acquisition and revenue channels.
Typical questions in this area are:
- Which channels bring the most qualified visitors?
- Which campaigns lead to real sales, not just clicks?
- How much does it cost to get a lead or a customer from each channel?
- Which messages and creatives work best for each audience?
Here you usually look at:
- traffic sources (search, social, email, partnerships, etc.),
- campaign parameters (medium, campaign, content),
- costs (ad spend, discounts),
- and down-funnel results (leads, trials, signups, purchases, subscriptions).
You can think of it as the “front half” of the journey: how people discover you, decide to click, and move towards becoming a customer.
What Is Digital Experience Analytics and Why It Matters
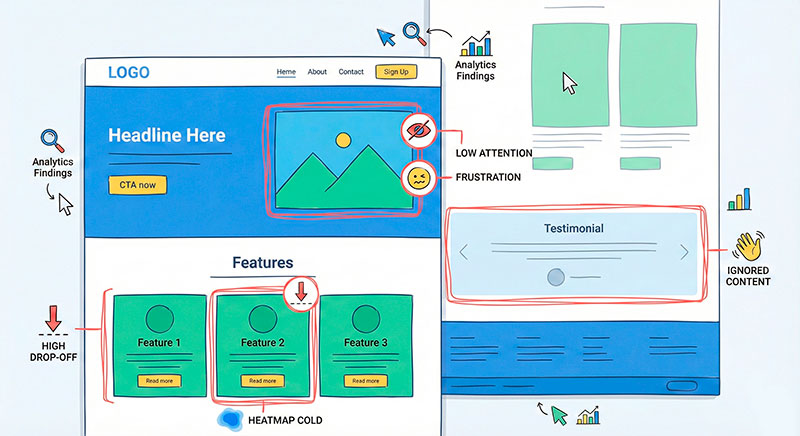
There is another important piece: digital experience analytics. While marketing analytics focuses on where people come from and whether they convert, experience analytics focuses on what they actually do on your site or in your app.
Here you care about things like:
- how far people scroll on a key page,
- where they hesitate or move their mouse in a strange way,
- which elements create rage clicks,
- which parts of a form cause the most drop-offs.
This type of analytics helps you answer questions such as:
- “Why do so many people abandon the checkout on step 3?”
- “Which section of the landing page actually convinces people to click the main button?”
- “Is our mobile layout making it hard to complete the form?”
Marketing brings the right people in. Experience-focused data shows whether your pages and flows make it easy for those people to understand your offer and take the next step.
Why Digital Analytics Is Important for Your Marketing
Why Is Digital Analytics Important for Modern Marketers?
Modern marketers live under pressure. Budgets are watched closely, competition is high, and privacy changes make tracking harder. At the same time, stakeholders expect clear answers: “What are we getting for this spend?”
With a solid data foundation, you can answer questions like:
- Which channels we should cut or scale.
- Where in the funnel we lose the most people.
- Which experiments are worth trying first.
- How many actual customers, not just clicks, came from each campaign.
Without this foundation, every decision turns into a fight between gut feeling, random opinions, and incomplete numbers. With it, you can explain your choices using simple evidence rather than long debates.
From “More Traffic” to “Better Results”
Many teams are stuck in a simple loop: “We need more traffic.” When results are weak, the first instinct is to raise budgets, launch more campaigns, or open yet another channel.
A more useful mindset is: “We need better results from the traffic we already have.”
Here’s a simple example. A team runs paid ads to a landing page and sees that traffic is growing, but sales are flat. Instead of buying even more clicks, they look at event and funnel data:
- Ad clicks are healthy.
- Landing page views are stable.
- Clicks on the main call-to-action are low.
- Very few people start the checkout, but those who do mostly finish it.
This tells them that the problem is not the checkout, but the page itself. Maybe the offer is unclear, the hero section is weak, or the page buries the key benefits. They run a few tests on messaging and layout, and suddenly the same traffic starts producing more leads and sales.
The ad budget did not grow. The analytics simply showed where effort would give the biggest return.
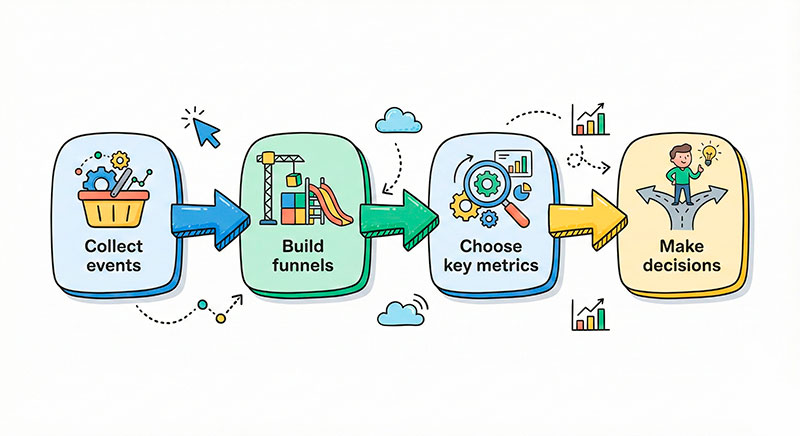
The Building Blocks of Analytics in Digital Marketing
Events: How You Capture What Users Do
When you design your tracking — often documented as an event tracking plan — you’re basically deciding which user actions matter enough to become events. Once those events are in place, you can slice and filter them to answer almost any marketing question.
Examples of events:
- viewing a specific page or screen,
- clicking a main button or link,
- submitting a form,
- starting a checkout or free trial,
- completing a purchase or subscription.
Events often have properties attached to them, such as:
- which campaign brought the user,
- which pricing plan they chose,
- which device or browser they used,
- which product category they viewed.
When you design your tracking, you’re basically deciding which user actions matter enough to become events. Once those events are in place, you can slice and filter them to answer almost any marketing question.
Funnels: How You Connect Steps Into a Story
A funnel is just a series of steps you expect people to follow. For a simple lead-generation campaign, a funnel might look like this. If you want a deeper visual overview of common funnel stages, this beginner-friendly marketing funnel guide is a good reference.
- Click on the ad.
- View the landing page.
- Click the main call-to-action.
- See the form page.
- Submit the form.
- Land on the thank-you page.
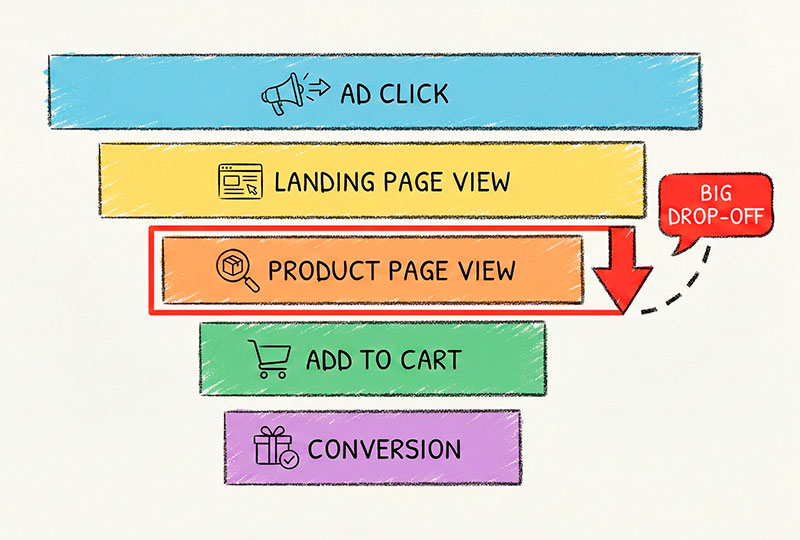
When you chart this funnel, you see how many people move from one step to the next. The magic is in the drop-offs:
- Maybe most people who see the landing page never click the CTA.
- Or maybe many start the form but never submit it.
- Or maybe they submit, but the tracking for the thank-you page is broken.
By looking at these gaps, you know where to focus:
- Improve the hero section and offer if people don’t click the CTA.
- Shorten or simplify the form if people start it but don’t finish.
- Fix tracking and integration issues if conversions are not recorded correctly.
Funnels turn “conversion rate is low” into “we lose most people between step 2 and 3, let’s fix that first”.
Metrics: From Vanity to Actionable
Metrics are the numbers you calculate from your events and funnels. Not all metrics are equal.
Vanity metrics sound impressive but rarely change your decisions. They make numbers look big, but they don’t tell you whether your marketing is actually working. Typical examples include:
- total impressions,
- total page views,
- total followers,
- raw click counts with no context.
Actionable metrics are tied to clear questions and decisions. Examples:
- conversion rate from landing page view to signup,
- cost per lead or cost per purchase,
- revenue per campaign or per channel,
- customer lifetime value by source.
Here’s a simple mapping:
- Metric: Conversion rate from ad click to purchase
Question it answers: “How good is this campaign at creating real customers?” - Metric: Cost per lead from a specific channel
Question: “Are we paying too much to get someone interested?” - Metric: Revenue per email subscriber over 90 days
Question: “Is our email program worth the effort compared to paid ads?”
When you pick metrics this way, your reports stop being random numbers and start looking like a set of answers to your most important business questions.
Digital Analytics Examples: Real-Life Marketing Scenarios
Even the best theory only makes sense when you see it in action. Let’s look at a few scenarios where analytics helped a team change their decisions.
Example 1 – Fixing a Leaky Lead Generation Funnel
A B2B team was paying for clicks to a “Book a demo” page. The ads looked good, and the click-through rate was healthy. But the number of demo requests stayed low.
They built a simple funnel:
- Ad click.
- Landing page view.
- Click on “Book a demo”.
- Form view.
- Form submit.
- Thank-you page view.
The funnel showed a huge drop between “Form view” and “Form submit”. People were starting the form, but many gave up.
When they looked at recordings and heatmaps, they saw that the form asked for too many details up front, including fields that felt sensitive for a first contact. They simplified the form, kept only the essentials, and moved some questions to the actual call.
Result: the same ad budget started bringing almost twice as many completed demo requests.
Example 2 – Cutting Wasted Ad Spend
An e-commerce brand was running three main ad channels. One channel delivered very cheap clicks, so it looked like a winner in basic reports. Another channel had high cost per click, so the team hesitated to scale it.
When they connected campaign data with purchase events and customer value, a different picture appeared:
- Channel A: lots of cheap clicks, but very few purchases and very low average order value.
- Channel B: moderate clicks, but a solid conversion rate and healthy order value.
- Channel C: fewer, more expensive clicks, but the highest conversion rate and repeat purchase rate.
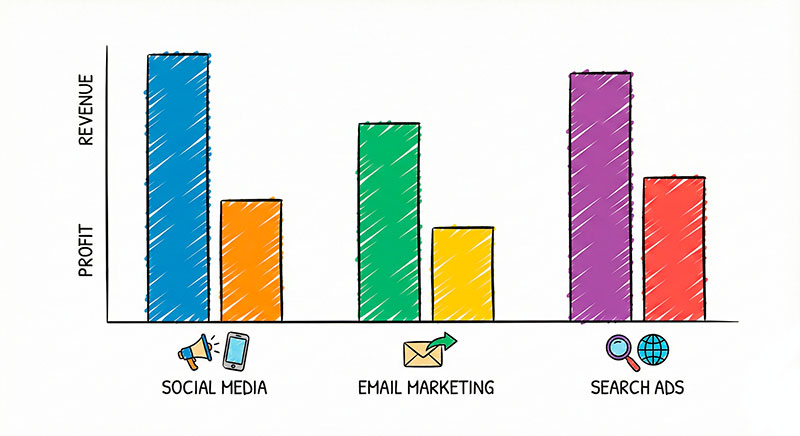
They shifted budget away from Channel A and towards B and C. Total clicks went down, but revenue and profit grew. Analytics helped them see beyond “cheap traffic” and focus on the sources that brought valuable customers.
Example 3 – Improving Landing Page Experience
A SaaS startup had a popular blog article that ranked well and drove consistent organic traffic. They added a banner and a call-to-action on the page to promote a free trial, but signups were disappointing.
Event data and behavior analysis revealed a few issues:
- Many readers never reached the banner because it was too far down the page.
- On mobile, the banner looked like an ad and was ignored.
- The main trial signup button was below a long block of text that few people scrolled through.
They changed the layout so that:
- The trial offer appeared earlier in the article.
- The banner looked more like a native part of the content.
- The main button was placed in a section that most readers actually reached.
With the same traffic and content, the trial signup rate from that article increased noticeably. The insight did not come from “more visitors”, but from understanding how people interacted with the page and applying basic conversion rate optimization principles.
Summary and Next Steps
Analytics for marketing is not about drowning in dashboards. It’s about clearly seeing how your actions lead to results. You launch a campaign, people move through a journey, and data shows you where that journey works and where it breaks.
Digital analytics gives you the bigger picture across your product and channels. Marketing-focused reporting zooms in on how people arrive and become customers. Experience-focused data shows what they actually do on your pages and in your flows.
The building blocks are simple: meaningful events, clear funnels, and a small set of metrics that answer real business questions. When you put them together, you can confidently explain which channels to scale, which pages to fix, and which experiments to run next.
A practical next step is this: choose one key funnel in your marketing, map its steps as events, and measure how many people move from one step to the next. Often, just seeing this one picture will highlight the most powerful change you can make this month.